
A year ago, we at Taboola kicked off a POC to migrate our Spark workload from the thousands of CPU cores cluster to the GPU. I started with a small test, just to get a hunch of what it would require and very quickly found myself in an intense project involving a great group of people from Taboola and NVIDIA’s Rapids team. In this blog post, I’ll describe what Taboola does with Spark, our motivation to move to Rapids and the insights, pitfalls, challenges and achievements so far.
Taboola’s Business
Taboola is the leading content recommendation company in the world. When you surf the web and see a native advertisement, it’s most likely a content served by Taboola. In order to do so, Taboola uses a very complex data pipeline that stretches from the user’s browser or phone, through multiple data centers running complex Deep learning algorithms, databases, infrastructure services such as kafka and thousands of servers in order to serve the best fitting ad for the user. This blog will focus on one component in this complex pipeline – our thousands of CPU cores spark cluster and our effort to migrate it to the GPU. Data to this cluster arrives from data centers all over the world where we collect and build a unique “page view”. A pageview is a very big and wide data structure identifying each user and its interaction with our system. This pageview structure, containing over 1500 distinct columns and amounts to over 1TB of hourly data, is what we process in our Spark cluster.
Project Motivation
Motivation originated from the fact that the CPU cluster scale out is very challenging in terms of both hardware costs and data center capacity. In order to cope with the increasing load of data needed to be processed, Taboola is required to increase its Spark cluster capacity quite often. We have many distinct analyzers, SQL queries, that process the incoming pageviews, 1TB of raw data, every hour with a 2, 6, 12 and 48 catchup runs. New analyzers are being created all the time and increase the load on the Spark cluster, hence the constant need for more compute power. NVIDIA’s Rapids accelerator for Spark was a perfect match.
It is POC Time
We first defined what we are going to test. We took real production data from “Cyber Monday” so that we’d test and benchmark a very big dataset. The data is 1.5TB of ZSTD compressed parquet files, per hour. It has over 1500 columns, of all native types including arrays, structures, nested structures with arrays, the full monty. Hardware wise we started with a 72 CPU cores Intel server with 3 A30 GPUs, 900 GB local SSD drive for Spark to store its intermediate files, 380GB RAM and a 10Gb/s NIC card. We set a minimum bar of x3 factor so that the GPU solution would be considered a successful one cost wise. We picked 15 queries from production from multiple R&D departments that would resemble as many of the hundreds of queries we have in production. These queries are mostly very complex including many SQL operations such as: aggregations, sorts, lateral view explode, distribute by, window functions and UDFS. Figure-1 shows such query.
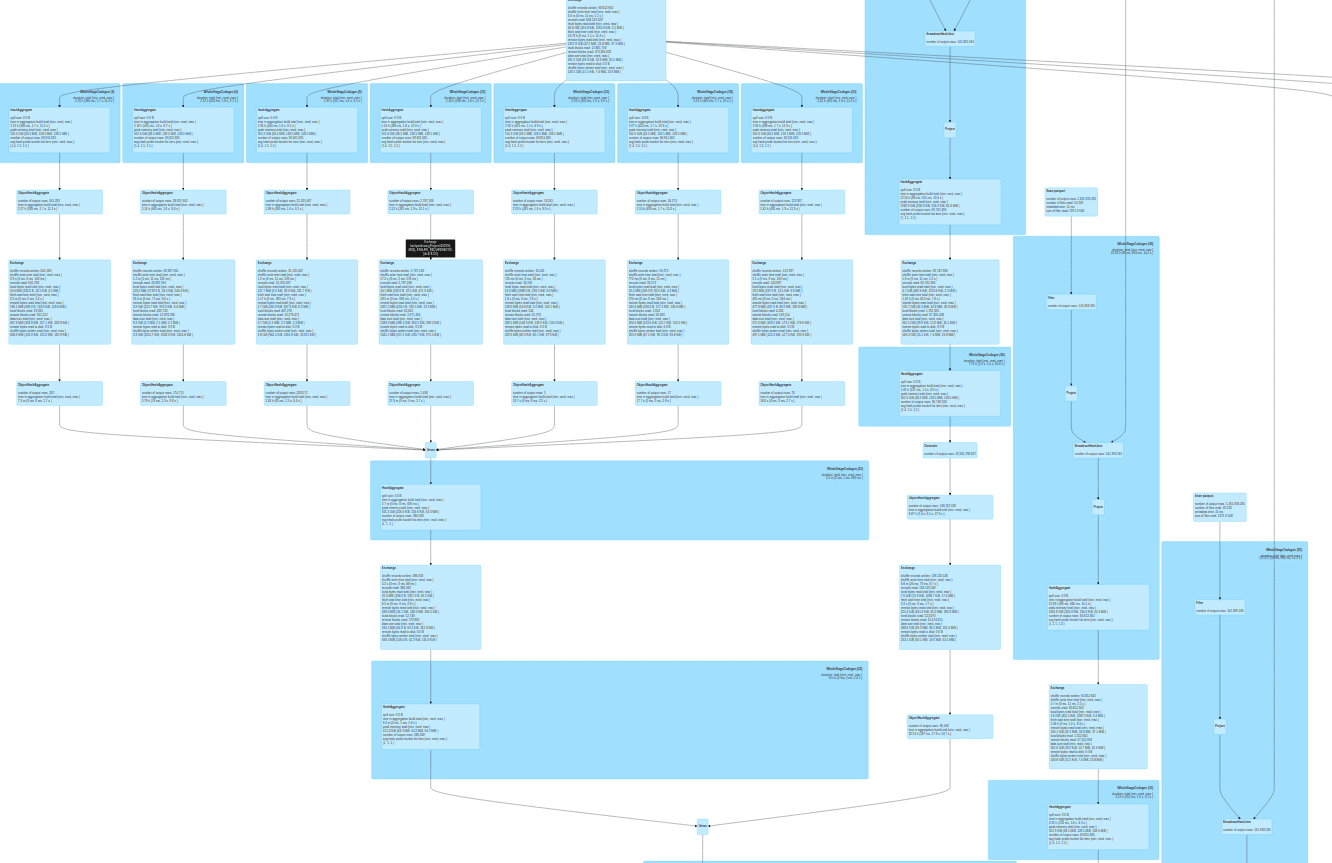
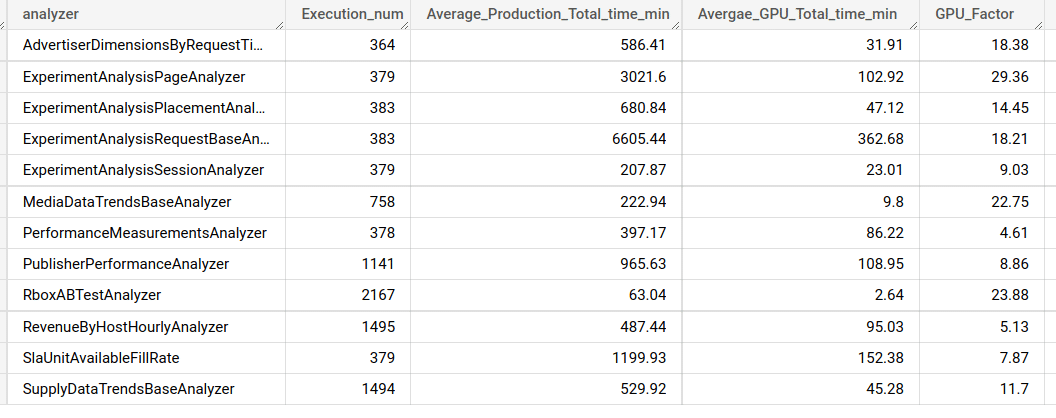
Figure-2 gives you a sneak peek as to the factors we got.
POC Goals
We started with a single server as described above, however obviously we’d want it to scale to a multi-GPU and multi server cluster. The cluster would be managed by Kubernetes, as opposed to our current Mesos cluster. Mesos is going to be obsolete and NVIDIA supports Kubernetes. Taboola’s R&D should be oblivious to the change and should not care whether their queries run on CPUs or GPUs. GPU output should be the same as the CPU, a task which is sometimes challenging when migrating to the GPU, but one that the Spark Rapids team is very aware of. Stability in production is also a crucial goal.Lastly, the GPU should outperform the CPU by a minimum factor of 3. We benchmarked several GPUs, P100s, V100s, A100s and A30 and found out that the A30 was the best price performance fit.
Run Rapids Run
I ran some SQL queries using Rapids and the results were a bit disappointing. Some of the less complex queries, mostly with lateral view explode, gave a x3 – x5 factor over the CPU. Some showed much lower factors while some queries even crashed. I started to ask around in Rapid’s github repo, played with the relevant Spark and Rapid’s specific parameters and started to get better results. The relevant parameters were:
- sql.files.maxPartitionBytes – The CPU uses a default value of 128MB, for the GPU it is too low. We are using 1-2GB.
- sql.shuffle.partitions – We found the 200 default to be good enough in most cases.
- rapids.sql.concurrentGpuTasks – Determines the number of tasks that can be run concurrently on the GPU. You should try to use at least two.
Tuning these parameters helped the queries to run more smoothly and perform better in some cases.
First Bottleneck
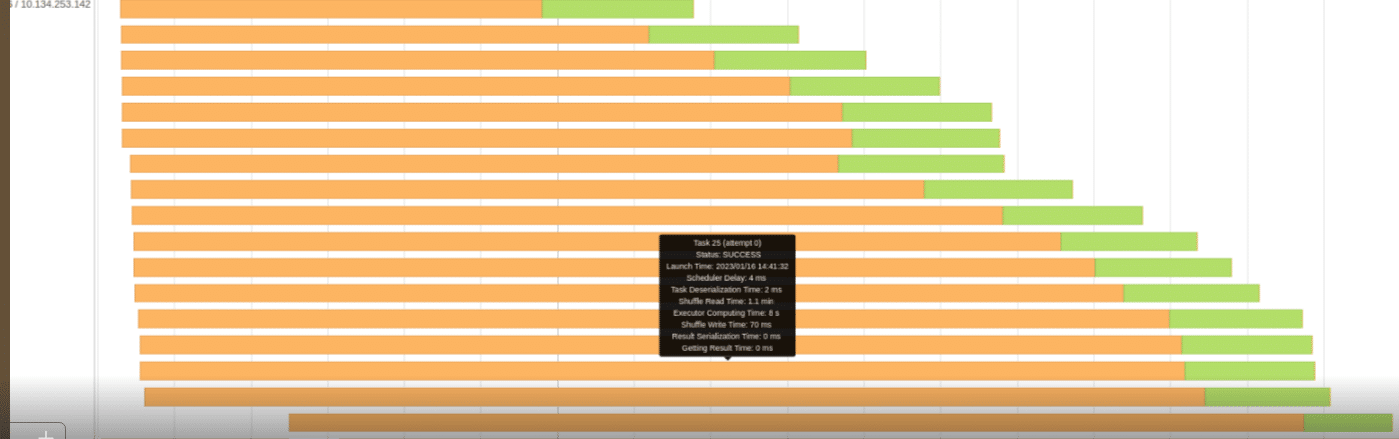
So what is holding us back? We’ve profiled some of the less performant SQLs and saw that most of them wasted a lot of time while parsing Parquet’s footer data on the CPU. Our Parquet data has more than 1500 columns and apparently the regular Java code that is parsing the footer was not adequate for such a big footer. Figure-3 shows a snippet of NVIDIA’s profiler output showing a 9 seconds Spark task, where the GPU was mostly idle and only worked for 330ms.
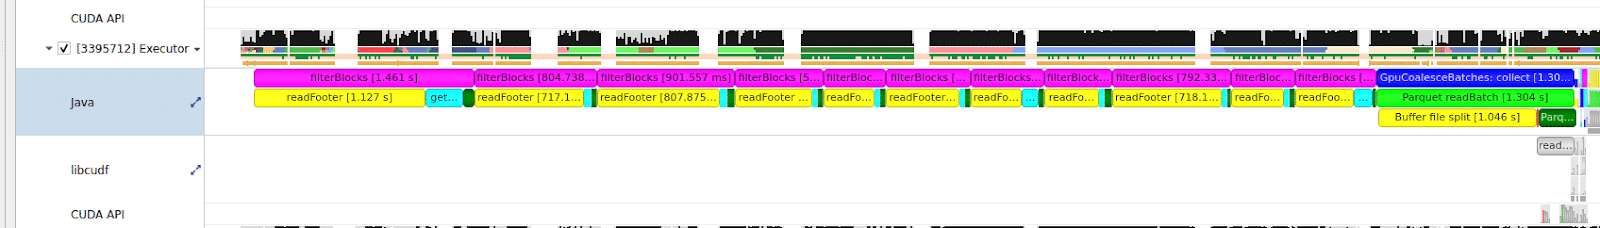
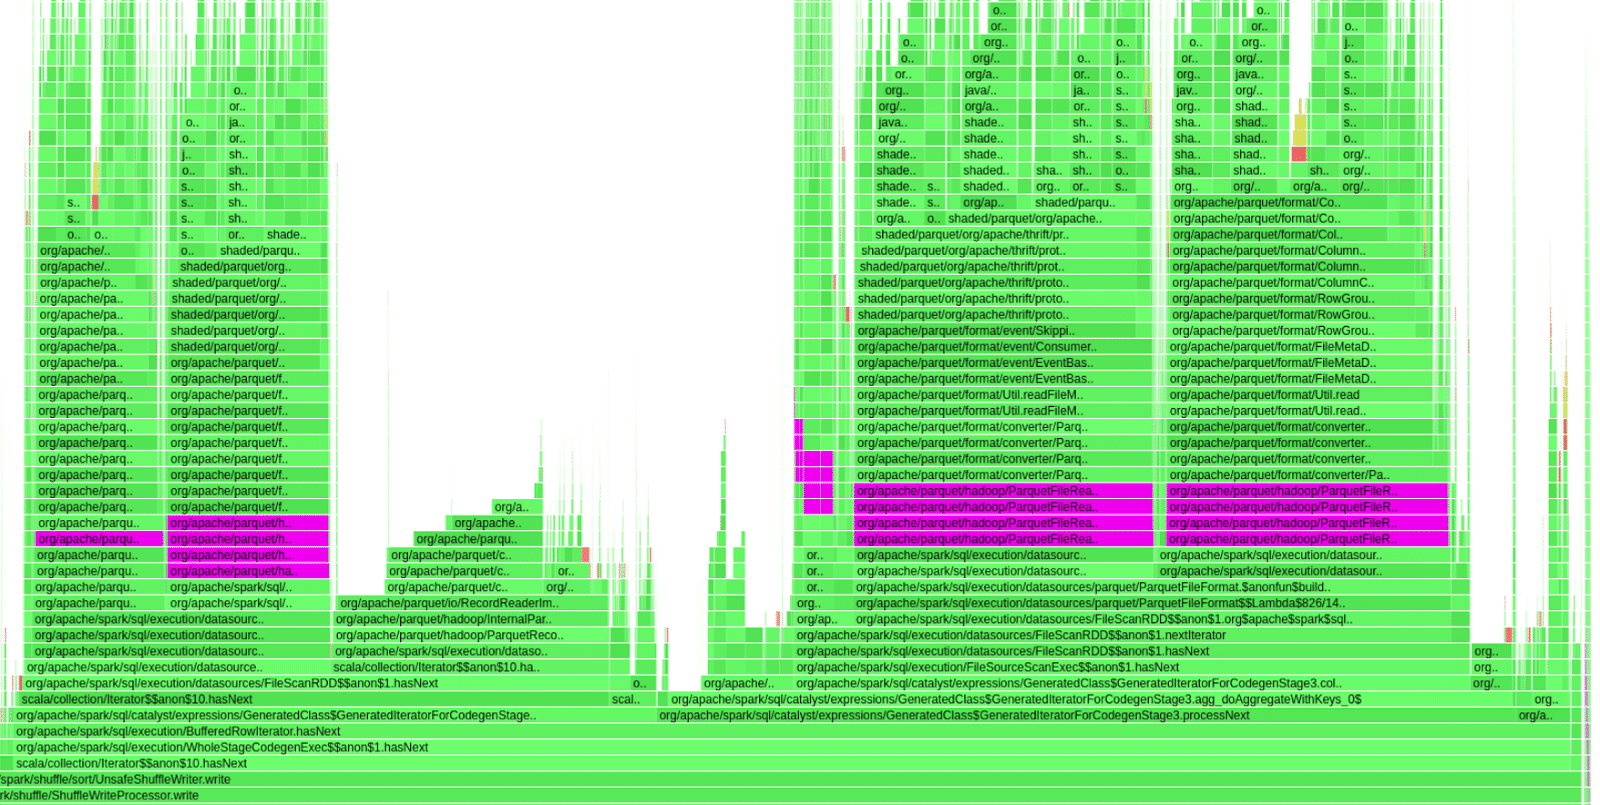
Figure-4 shows a flamegraph of one of our queries that suffered from this behavior. The purple bars indicate time spent inside the org.apache.parquet.hadoop.ParquetFileReader class. Almost 50% of this query time was spent on parsing Parquet’s footer, during that time the GPU was idle.
We set off to test an idea we had. When parsing the footer, Parquet’s code would iterate over the footer metadata serially for each row group. We made some adjustments to Parquet’s parameters and decreased the number of row groups we had in each file. That gave us about 10-15% improvement but obviously was not enough. Remember that we have 1500 columns so each time a footer metadata is read, even though we’re only asking for 50-100 columns per query, the entire 1500 metadata would be read and parsed serially. We wanted to index the footer metadata so that instead of reading the entire 1500 columns data serially, we’d just access it directly. We managed to pull this off by changing Parquet-mr public code in C++ and Java and did get nice performance results, however it was too cumbersome and complex. Luckily for us, the Rapids team at NVIDIA came with a much better idea and replaced the Java code with Arrow’s C++ implementation. We now have the rapids.sql.format.parquet.reader.footer.type set to NATIVE by default for our GPU implementation. Bottleneck resolved. No more queries with the GPU idle because of footer parsing overheads on the CPU.
Network Bottleneck
The next bottleneck was caused by the fact that the network card was too weak. While the 10Gb/s ethernet card sustained the CPU load, it failed to do so for the GPU load. Replacing it with a 25Gb/s card, resolved this bottleneck.
Disk I/O Bottleneck
So two bottlenecks resolved, queries still run slow, now what? Looking in Spark’s UI page, gave a clear indication as to what is happening now. See the following table.
| Metric | Min | 25th percentile | Median | 75th percentile | Max |
| Duration | 0.4 s | 0.6 s | 0.8 s | 1 s | 1.2 min |
| GC Time | 0.0 ms | 0.0 ms | 0.0 ms | 90.0 ms | 0.5 ms |
| Shuffle Read Size/Records | 21.4 MB/1000 | 22.3 MB/1000 | 22.5 MB/1000 | 22.7 MB/1000 | 27.3 MB/1000 |
| Shuffle Write Size/Records | 17.5 MB/1000 | 17.9 MB/1000 | 18 MB/1000 | 18.1 MB/1000 | 18.1 MB/1000 |
| Scheduler Delay | 3.0 ms | 5.0 ms | 5.0 ms | 7.0 ms | 3 ms |
| Peak Execution Memory | 64 MB | 64 MB | 64 MB | 64 MB | 64 MB |
| Shuffle Write Time | 9.0 ms | 13.0 ms | 18.0 ms | 21.0 ms | 59 s |
As can be seen above in the Max column, the task’s duration is 1.2 mins, while Shuffle Write Time is taking 58 seconds. Apparently we waste a lot of time doing shuffle work while the GPU is idle again. Figure-6 shows the appropriate event timeline graph. The orange part is shuffle times, read or write. The green parts are compute time. We’re wasting a lot of time reading or writing shuffle files.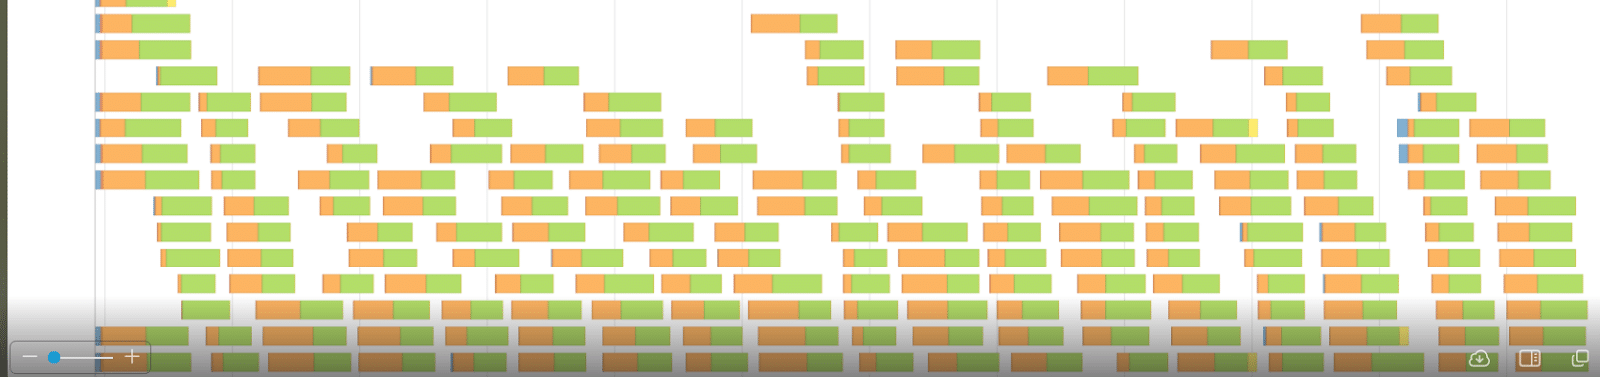
 Our shuffle files can get up to 500GB and higher in some queries. Obviously we can’t keep this huge amount of data in the server’s RAM so the shuffle files are stored in the local SSD drive. After a quick investigation with our K8s and IT teams, we figured out that the SSD drive was configured to use RAID-1, i.e. each temporary shuffle file was saved twice to the disk. This is absolutely a waste of time. Switching to RAID-0 somewhat improved the situation. The next thing was to switch to a 6TB NVME drive. That nailed it. We did have to take one of the GPUs out so that the NVME can be used but from that point we did not have any further performance issues with shuffle read or write. We also found out that, for our workload, one such NVME is capable of sustaining the load of two A30 GPUs. As with the network card bottleneck, the GPU put much more pressure on the SSD drive than the CPU to the point that we had to replace the SSD with a NVME disk.What about K8s?The move to K8s from a stand alone POC machine involved a lot of configuration work and small details but was quite straightforward. The basic idea is that Spark’s driver would sit on a non-GPU machine and each K8s POD would be associated with a single GPU. A “Getting Started with Rapids and Kubernetes” tutorial can be found here. Figure-7 shows some of the major K8s relevant configurations.
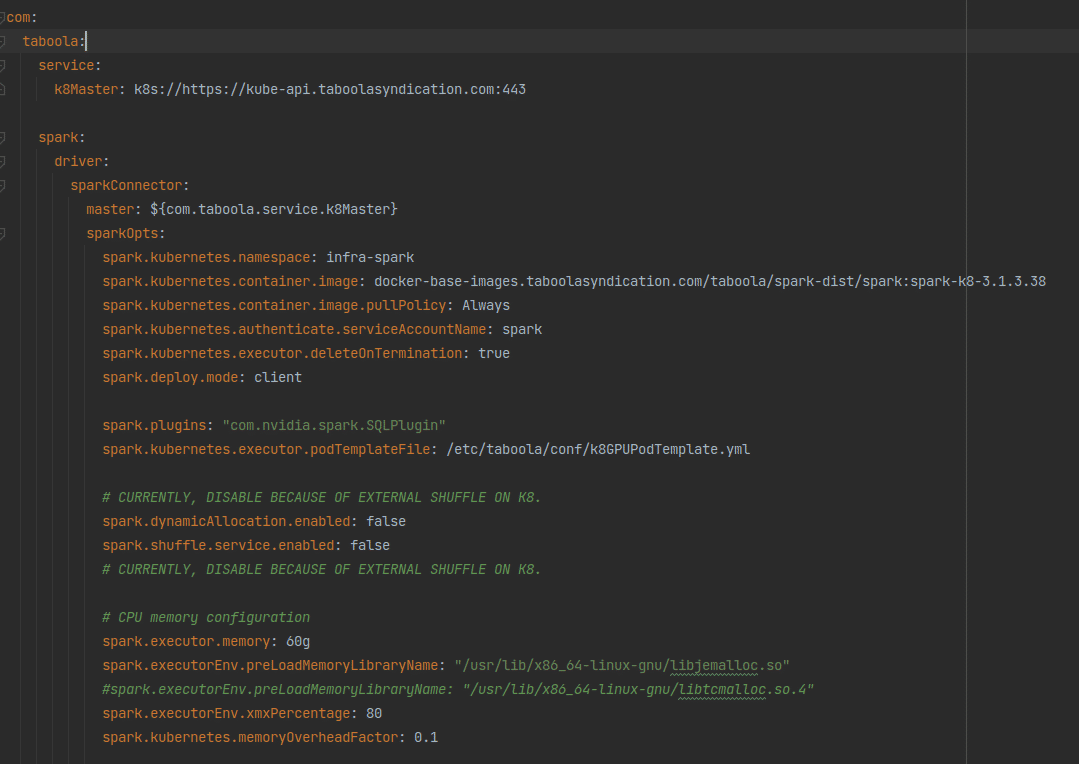 How fast is the GPU?The most interesting question when migrating a project from the CPU to the GPU is usually: What’s the factor? For a real world cluster with multiple GPUs the answer would be: How many GPUs do I need to sustain a load manageable by my X CPU cores. That’s your factor.Current StatusWe set up a system with two A30 GPUs and streamed the production data to it in parallel with our real big CPU cores production environment. Figure-8 shows two of our heaviest queries running in the production CPU cluster and on the server with the two A30 GPUs.
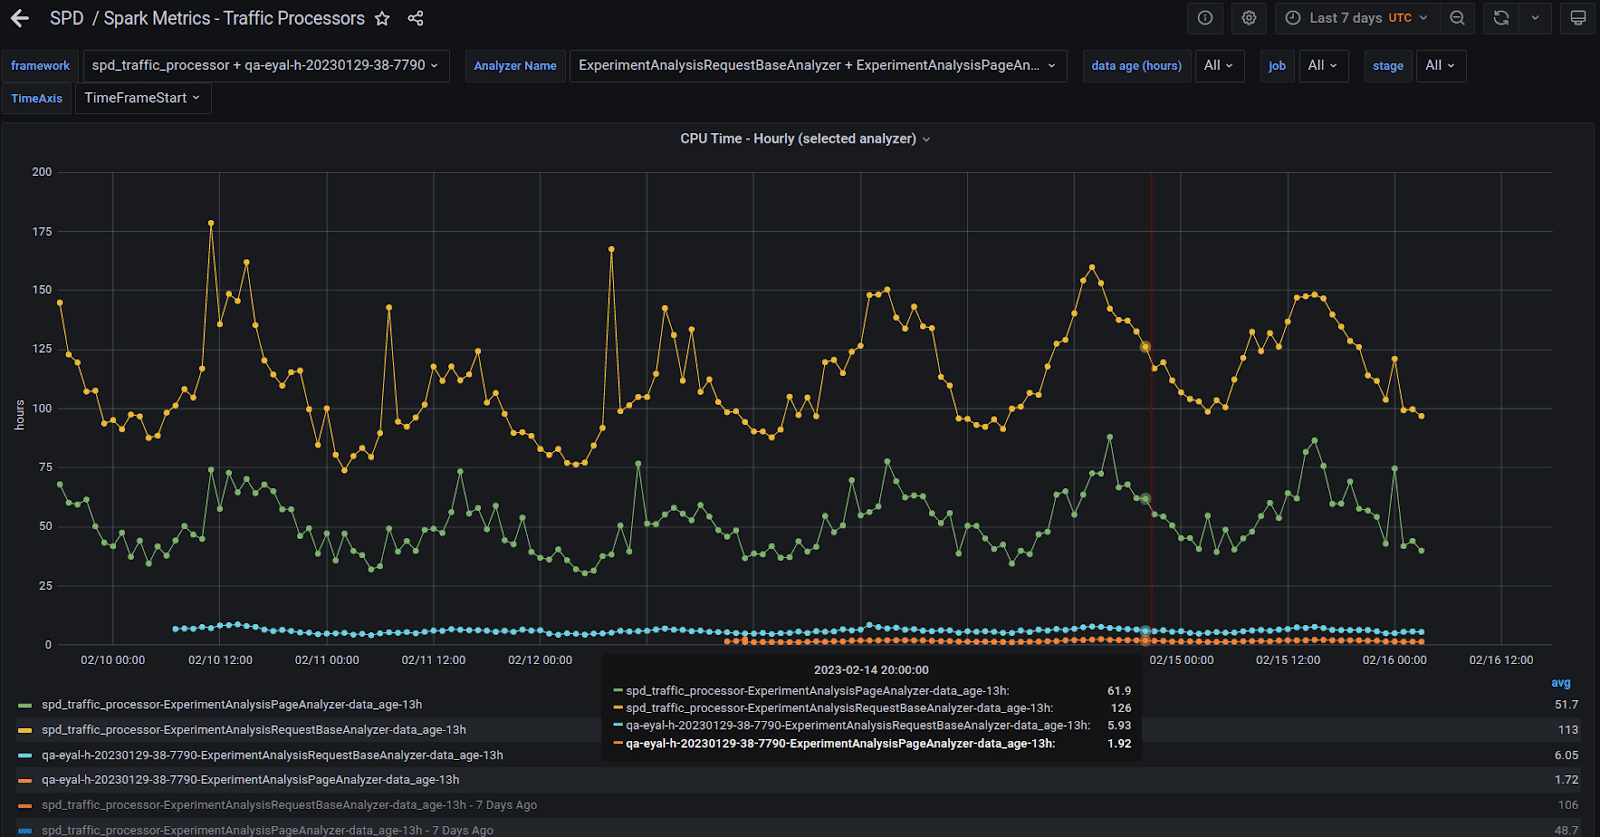 The yellow and green lines are the hourly total time across all tasks numbers of the two queries running on the CPU cluster. The blue and orange lines are the same queries running on the GPU server. GPU factors, for total time across all tasks, are x20 and above. Figure-9 shows a zoom in view of the GPU runs. You can see that they behave similarly to the CPU in that the graph behaviors are roughly the same.
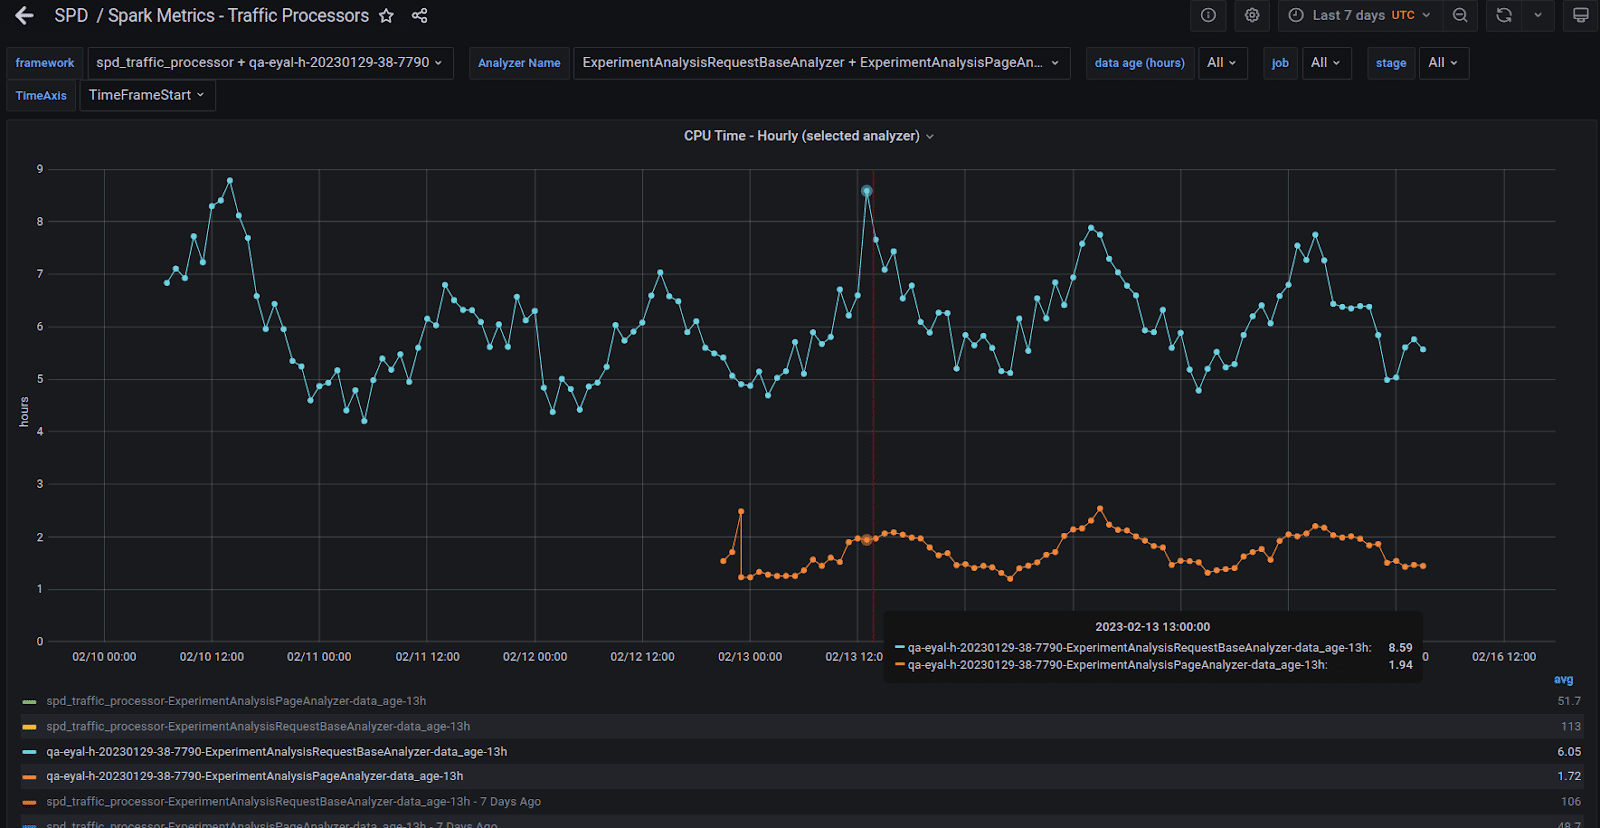 The next interesting graph shows the factor of all the queries we’ve migrated to the GPU and their counterparts on the CPU. The GPU run is missing the biggest query, which we are still working on migrating to the GPU. It should probably add another 200 hours per day to the GPU total time. See Figure-10 to see the daily accumulated factors, they are aligned with the x20 factor we’ve seen in Figure-9 as well.
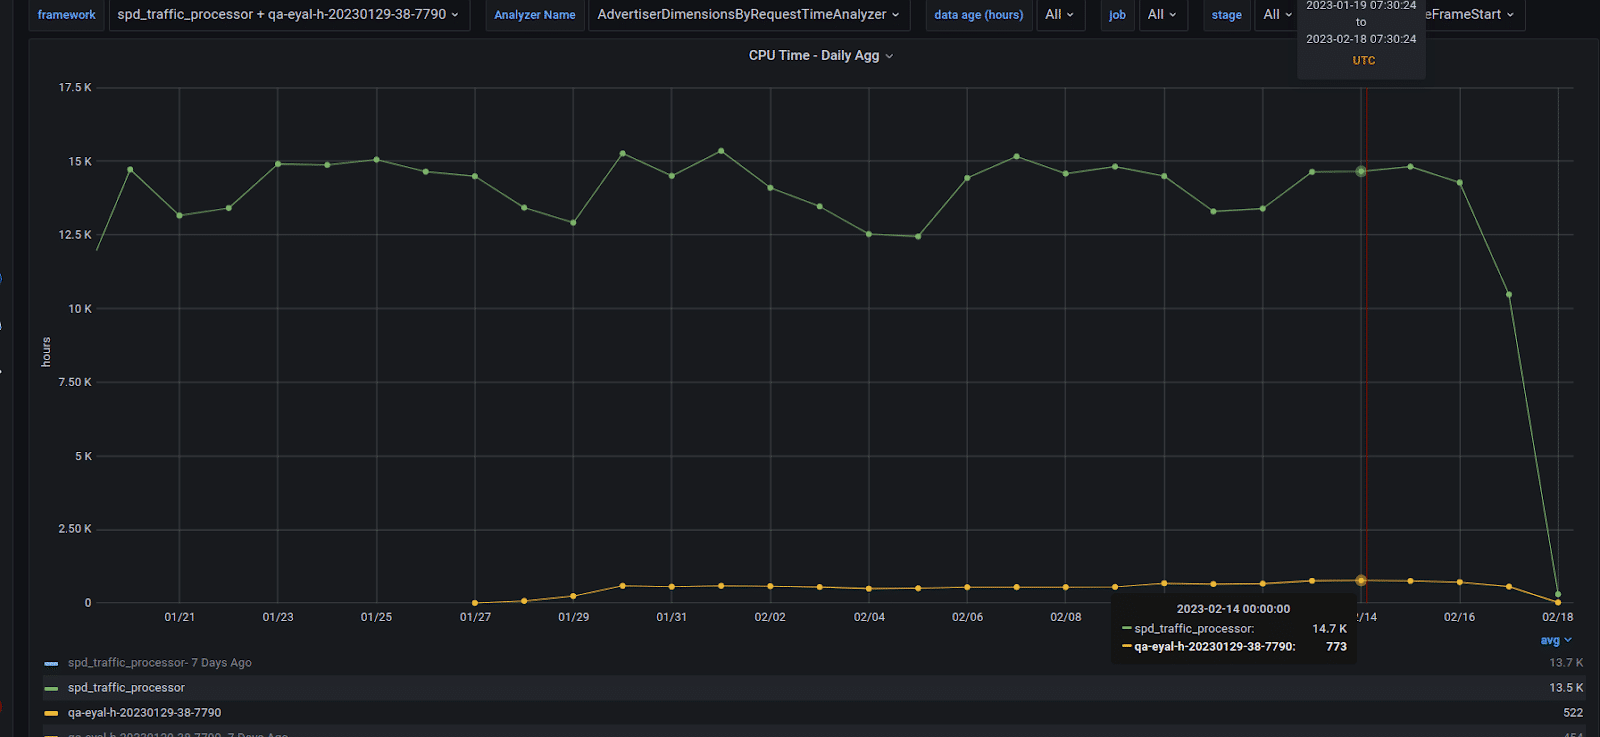 While we emphasize “Total time across all tasks” in the above images and text, as we go deeper and deeper into migrating more analyzers to the GPU, we’ve realized that a more important and accurate metric is the “duration” metric. In order to better evaluate the expected performance boost from the GPU, we’ve set a test cluster with 100 CPU cores, ran our queries and compared the duration of each environment for each query. The end game here is to be able to say that 100 CPU cores work took 4 minutes, for example, while one A30 GPU finished the same work after 2 minutes. That would indicate that one A30 GPU performs the same as 200 CPU cores, as a matter of fact, most of our analyzers showed this performance ratio in production.What’s next?Next would be to move more queries from other R&D departments to the GPU, which will result in increasing the number of GPUs in production. We’ve already on the verge of migrating another group of 15 heavy queries to the GPU. Soon we’re also getting dozens more A30 GPUs to join our GPU cluster and enable us to better cope with current and near future load. QA and monitor the system more closely while in production.ConclusionThis has been an amazing joy ride effort during which I got acquainted with Rapids. Learn all sorts of aspects that I haven’t had too much interaction with so far such as Parquet internal stuff. We had to Identify and cope with hardware limitations and push the GPU to its edge. The results, however, are extremely rewarding. This post, in another version of it, was also published by NVIDIA on their own blog site and can be found here: https://developer.nvidia.com/blog/gpu-integration-propels-data-center-efficiency-and-cost-savings-for-taboola/AcknowledgmentsThis huge effort could not have been successful without the support, assistance and patience of two great groups of people. Taboola: Andrey Gourine, Gilad Zamoscinski, Igor Berman, Keren Corsia, Lior Chaga and Michael Taranov. NVIDIA’s Rapids team: Alessandro Bellina, Hao Zhu, Karthikeyan Rajendran, Robert Evans, Sameer Raheja